Overview dashboard
A portfolio-style performance summary for one campaign, with a KPI strip, trends, funnel, live breakdowns, and a triage list.
The Overview dashboard is your reporting-style read on how a campaign is performing. Pick an ad account and campaign, and the whole view scopes to it: a KPI strip with change vs the prior window, a trends chart, a conversion funnel, live breakdowns by region, demographics, platform, and device, and a Needs attention list that points you at whatever needs you today.
At a glance
- What it shows
- Performance for one selected campaign
- You get
- KPI strip, trends, funnel, live breakdowns, and a triage list
- Best for
- A reporting read of performance and finding what needs attention
- Default date range
- Last 30 days, adjustable
- Cost
- Free to view
How it works
- 1
Open the Dashboard
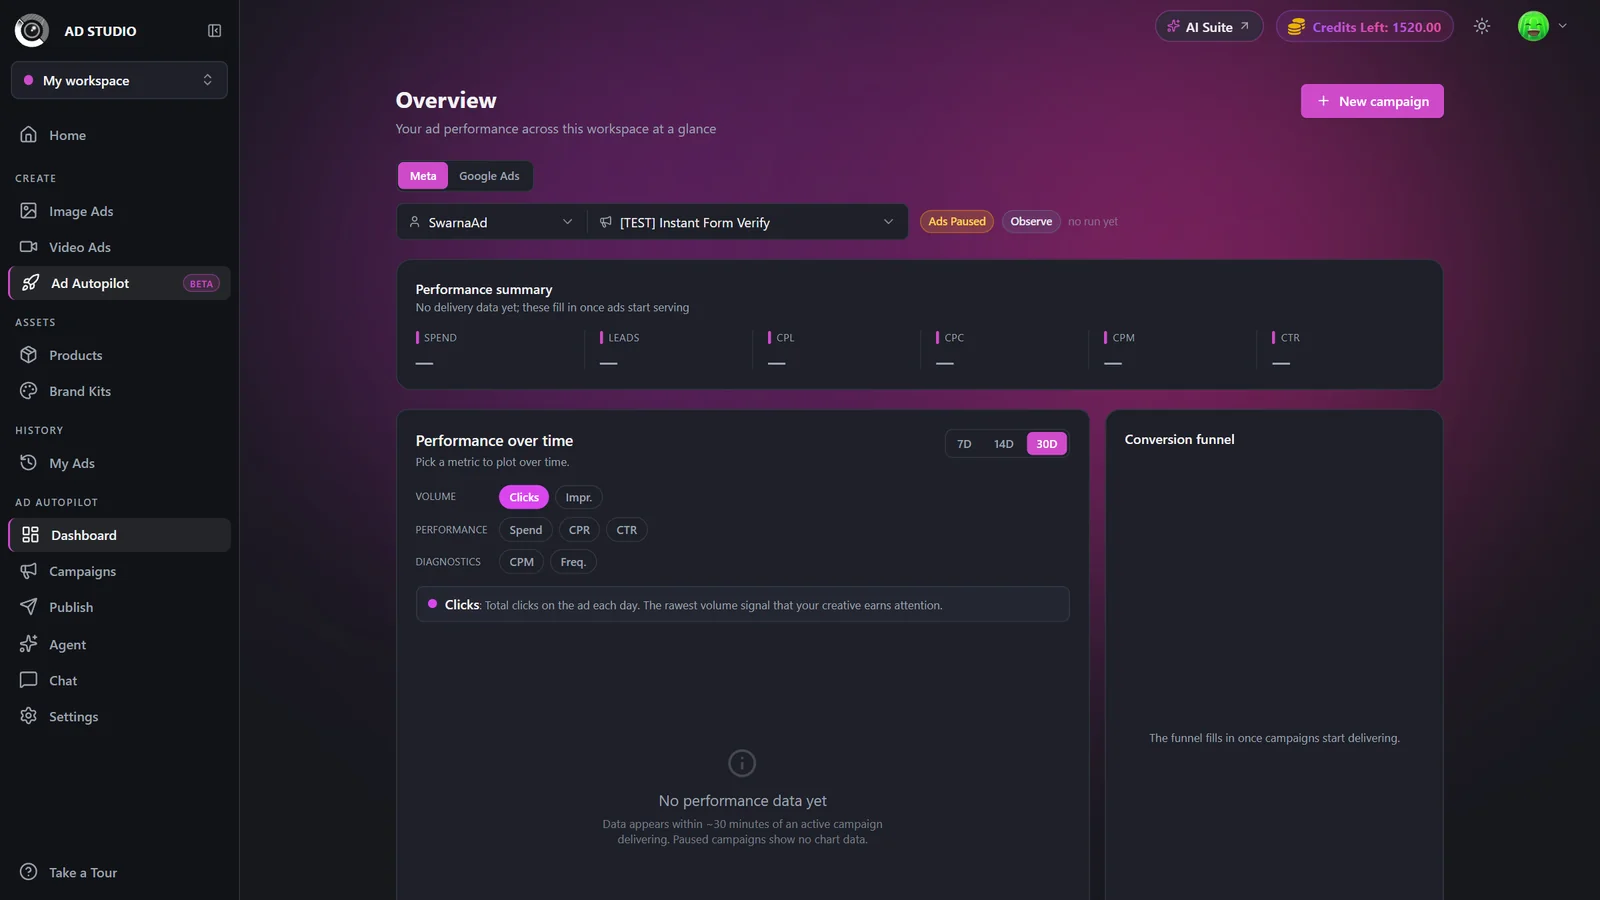
Select Dashboard from the Ad Autopilot sidebar. The section appears once a Meta account is connected.
- 2
Pick the ad account and campaign
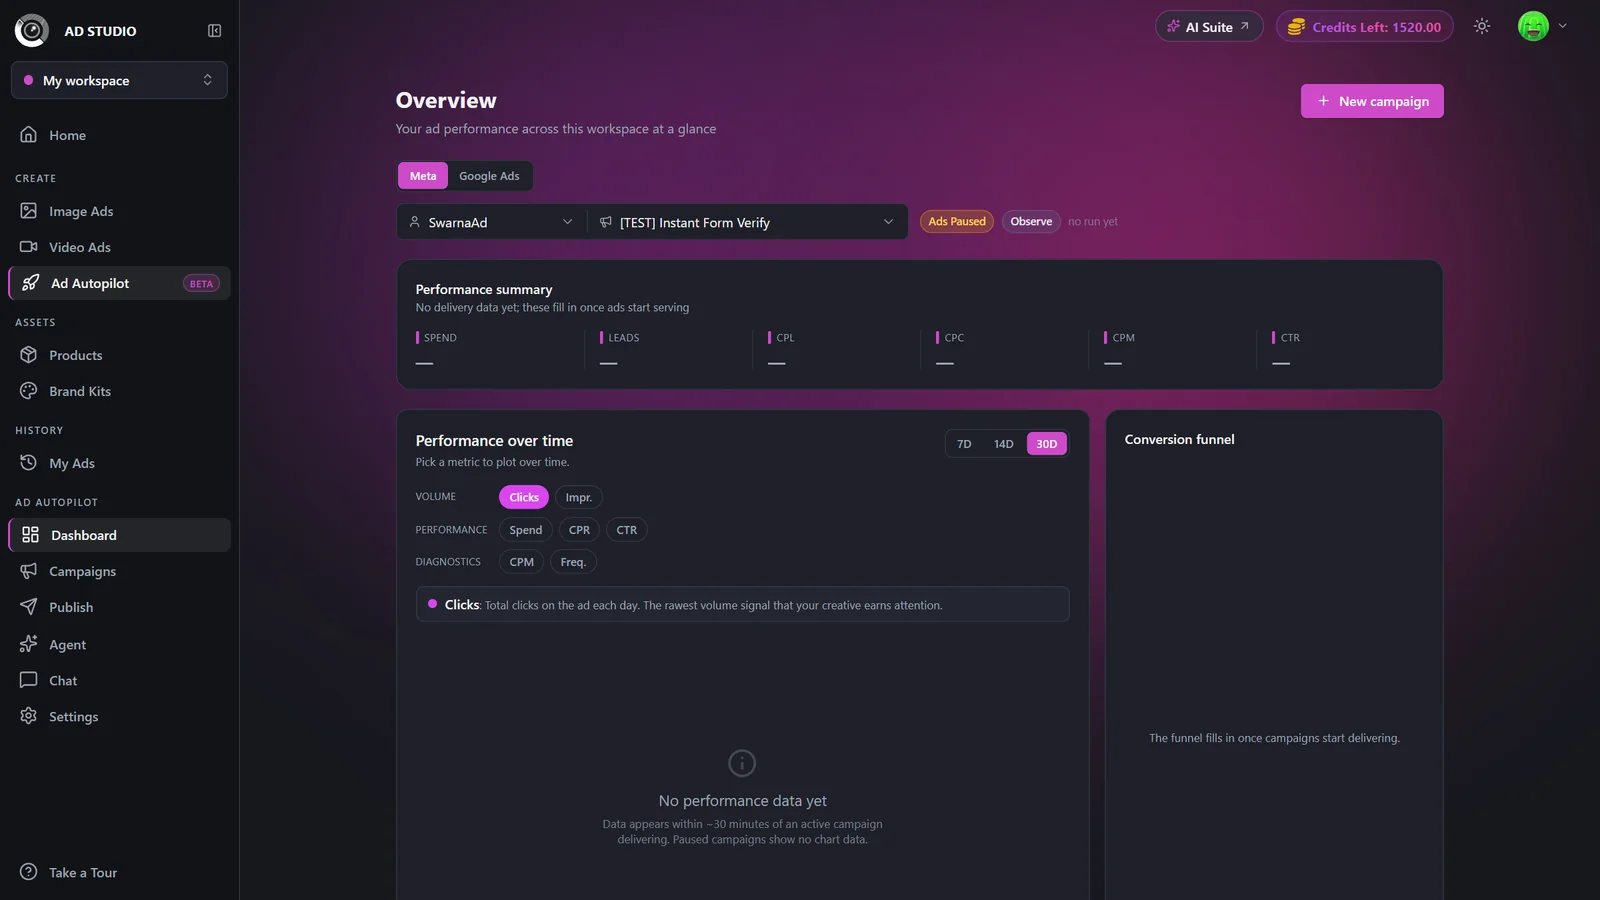
Choose one ad account and one campaign from the filter bar. The whole view scopes to that campaign, and the newest campaign is auto-selected for you.
- 3
Read the KPI strip and trends
Each KPI card shows a value, its change vs the prior window, and a sparkline. Below it, the trends chart and the conversion funnel show how delivery is moving over the selected date range.
- 4
Review the live breakdowns
Scan the breakdowns by region, demographics, platform, and device to see where delivery and results are concentrated.
- 5
Act on Needs attention
The Needs attention list surfaces campaigns with alerts, waiting approvals, or failed cycles. Use it to jump straight to whatever needs you.
Settings & options
| Setting | Options | What it does |
|---|---|---|
| Ad account + Campaign | Choose one of each | The whole view scopes to the selected campaign. The newest campaign is auto-selected when the page opens. |
| Date range | Adjustable (default last 30 days) | The comparison shows change vs the equivalent prior window when there is enough history. |
Rate metrics on the KPI strip are derived from summed daily totals rather than averaged across days, so you can trust them across the whole window.
Best practices
Trust the rate metrics across the window: they are derived from sums, never averaged.
Use the agent-state chips beside the filter bar to see the selected campaign's mode, last run, and any waiting approvals at a glance.
Start each session in Needs attention so you handle alerts, approvals, and failed cycles before browsing detail.
Widen or narrow the date range to match the question you are asking, then read the prior-window change for context.
Troubleshooting
The selected account may have no campaigns, or the campaign is paused with no delivery yet. Activate it to start collecting data.
The comparison only appears once there is enough history for the equivalent prior window. Give the campaign more delivery time.